[Comparison] AMD Radeon RX 5300M vs NVIDIA GeForce GTX 1660 Ti Max-Q – the 1660 Ti Max-Q proves that age doesn’t matter, as it crushes the RX 5300M
 The first of the mobile RDNA graphics cards is here, in the face of the AMD Radeon RX 5300M. With it come the questions of “How good it is against X graphics card?”.
We have already done some comparisons and are continuing to do more, in order to give you the most complete picture of should the RX 5300M be the GPU that will be powering your next device. For today we have picked a quite powerful challenger, the GeForce GTX 1660 Ti.
You can visit our Top Laptop Graphics Ranking, where we have the best GPUs for laptops, going from best to worst.
You can find more information about both GPUs here: AMD Radeon RX 5300M / NVIDIA GeForce GTX 1660 Ti Max-Q
Specs table
| Radeon RX 5300M | GeForce GTX 1660 Ti Max-Q | |
|---|---|---|
| Architecture | Navi | Turing |
| Lithography | 7 nm | 12 nm |
| Base / Max Frequency | 1181MHz / 1445MHz | 1140MHz / 1335MHz |
| Memory Type | GDDR6-14000MHz | GDDR6-12000MHz |
| Memory capacity | 3GB | 6GB |
| Cores | 1408 | 1536 |
| Power Consumption | 65W | 60W |
| Memory bus | 96-bit | 192-bit |
| Memory bandwidth | 168 GB/sec | 288 GB/sec |
GPU benchmarks
In 3DMark Fire Strike, the GTX 1660 Ti Max-Q performed 21% better than the RX 5300M. The same happened in Unigine Heaven 4.0, where the NVIDIA Graphics card scored 55% higher, and for the final benchmark, Unigine Superposition, the GTX 1660 Ti dominated again, this time with a 45% lead in performance. In the Gaming tests, which featured four of the most graphics-intensive games, the GTX 1660 Ti Max-Q had a big lead that was permanently in the double-digit numbers.
Results are from the 3DMark: Time Spy (Graphics) benchmark (higher the score, the better)
Results are from the 3DMark: Fire Strike (Graphics) benchmark (higher the score, the better)
Results are from the Unigine Superposition benchmark (higher the score, the better)
Gaming tests

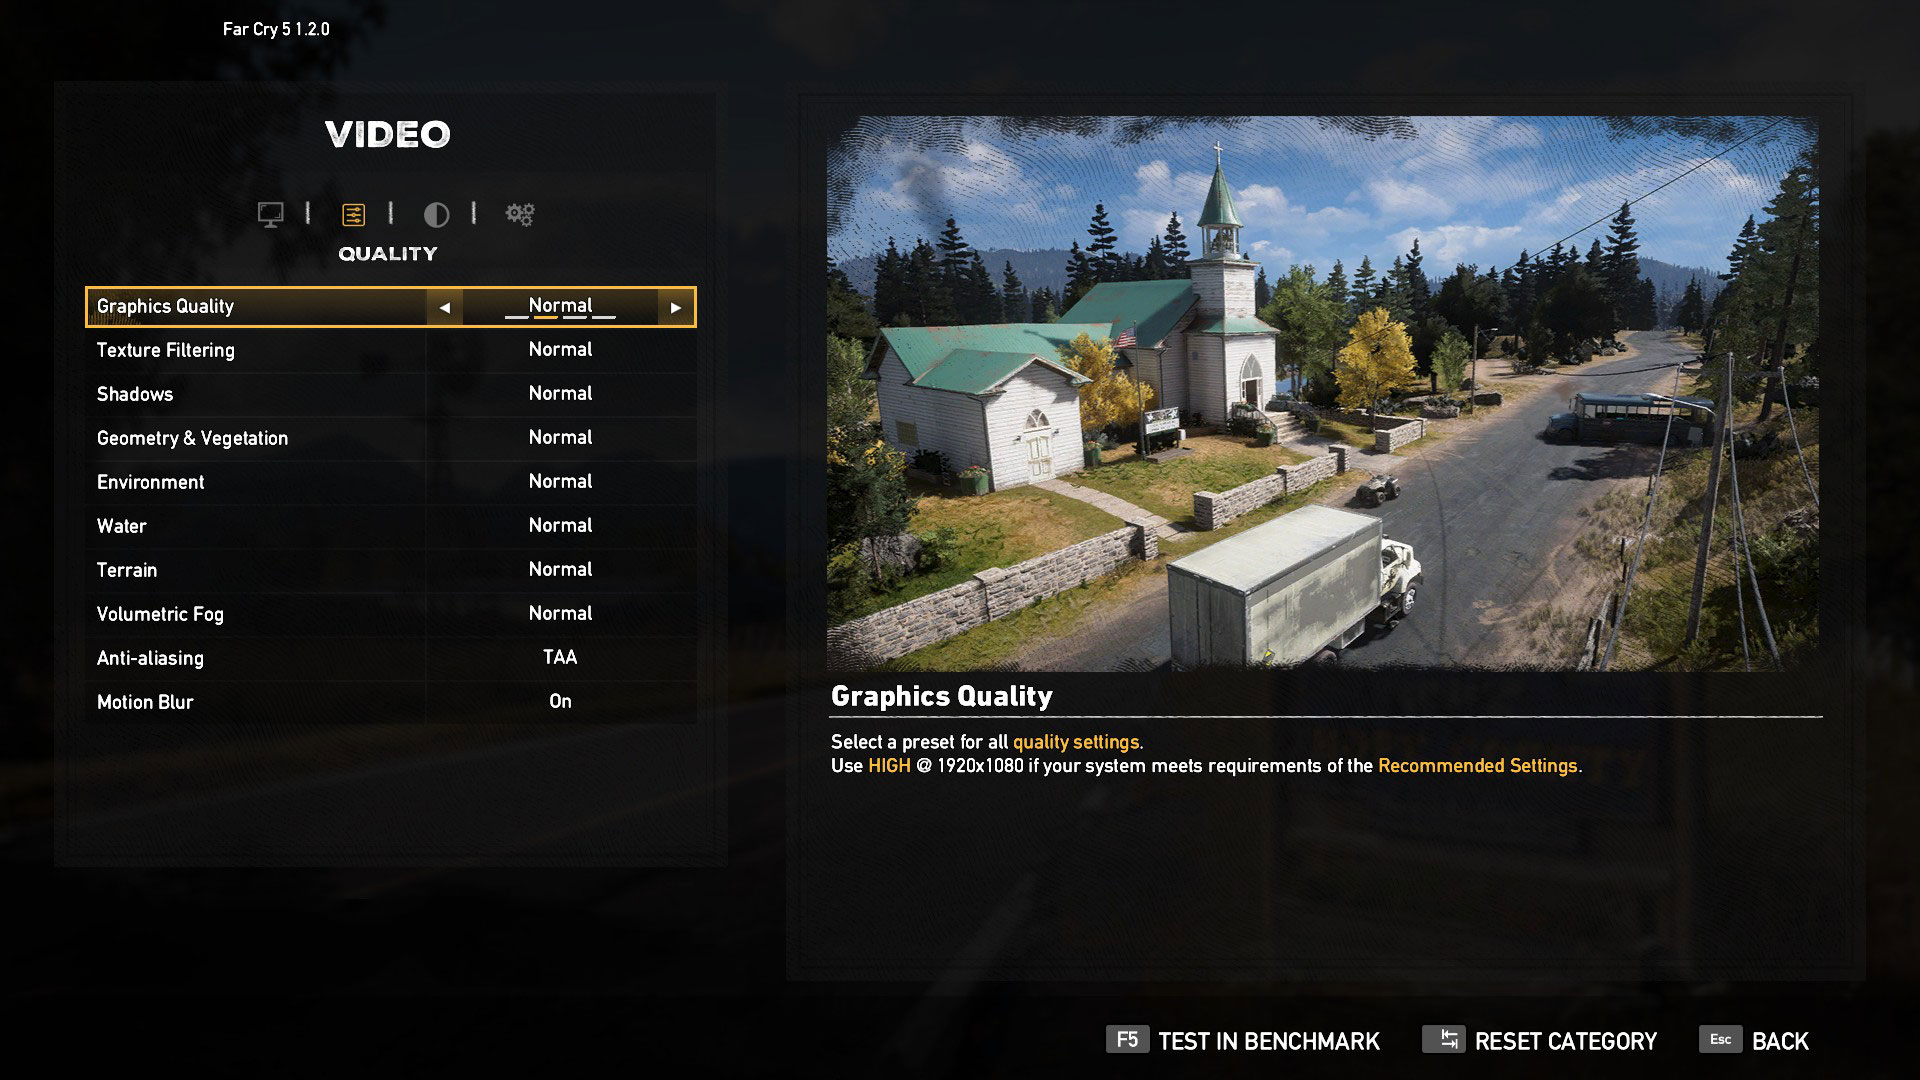
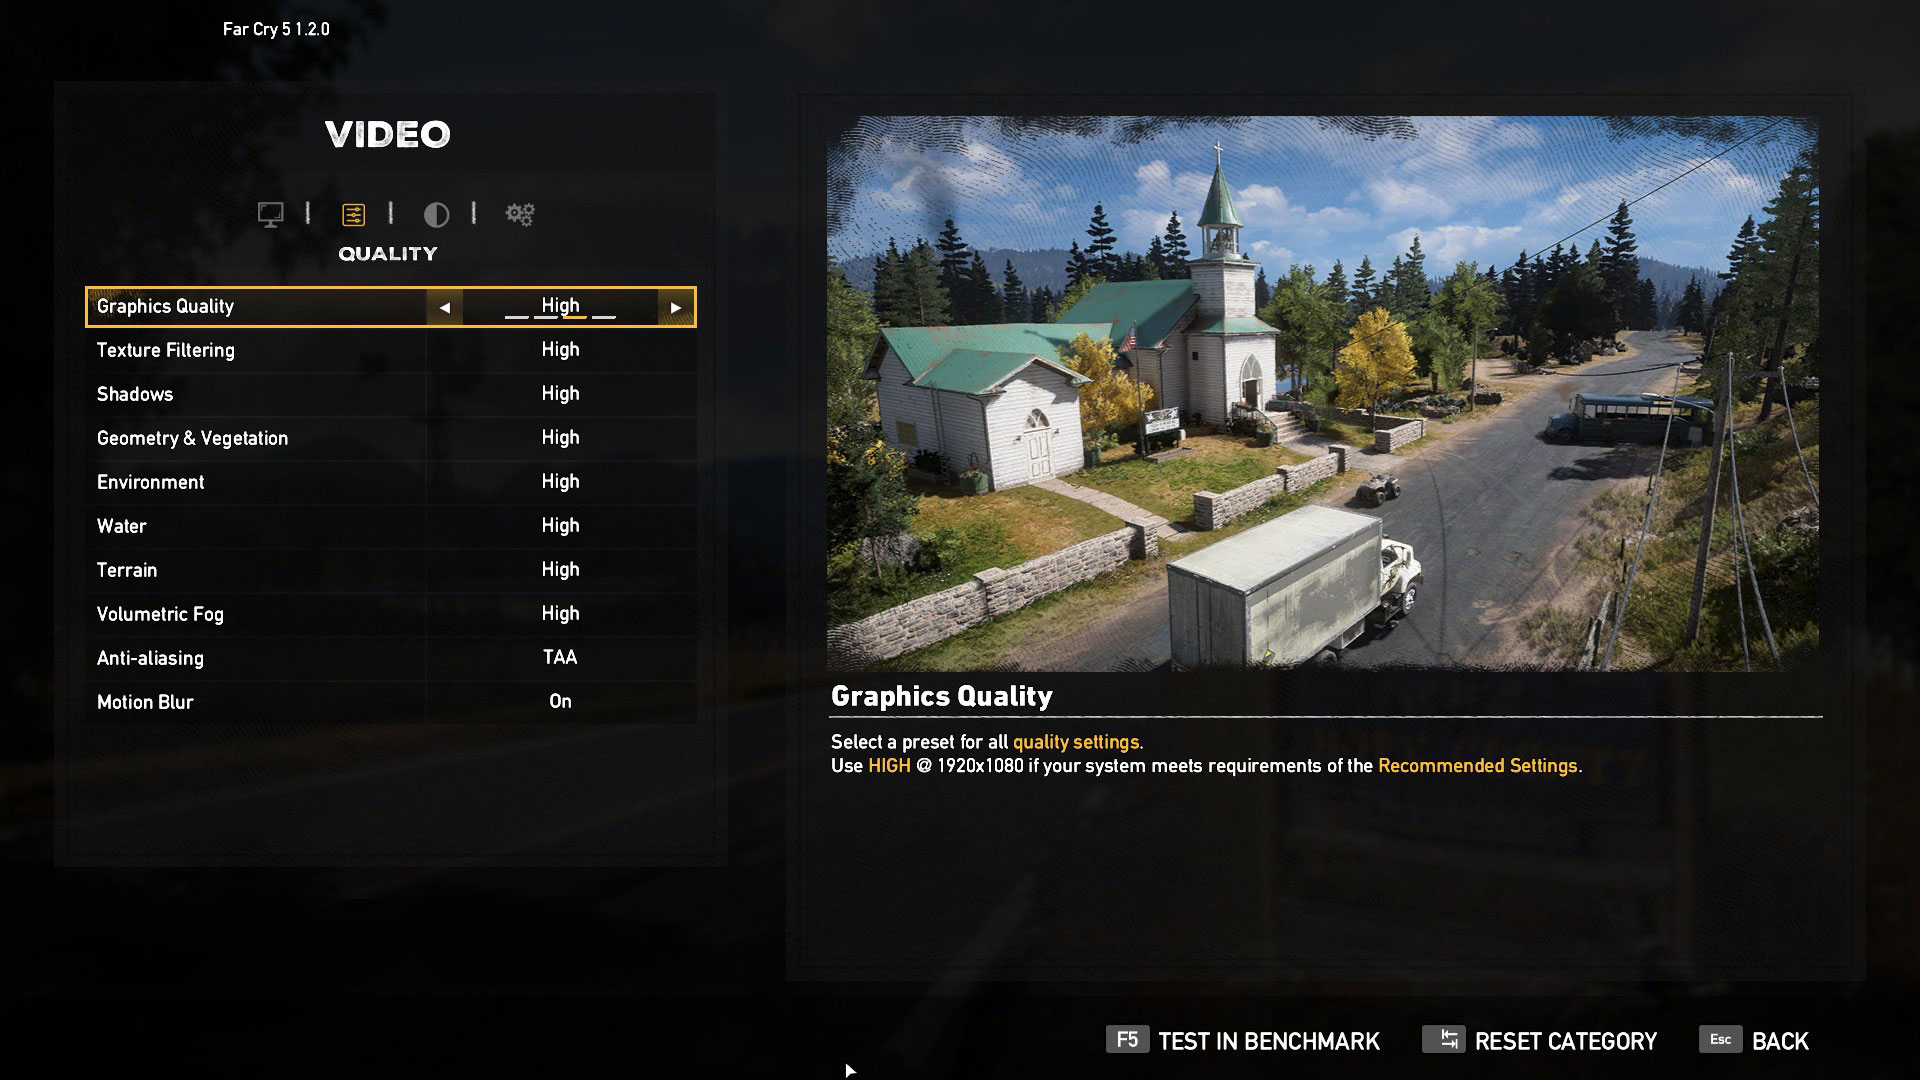
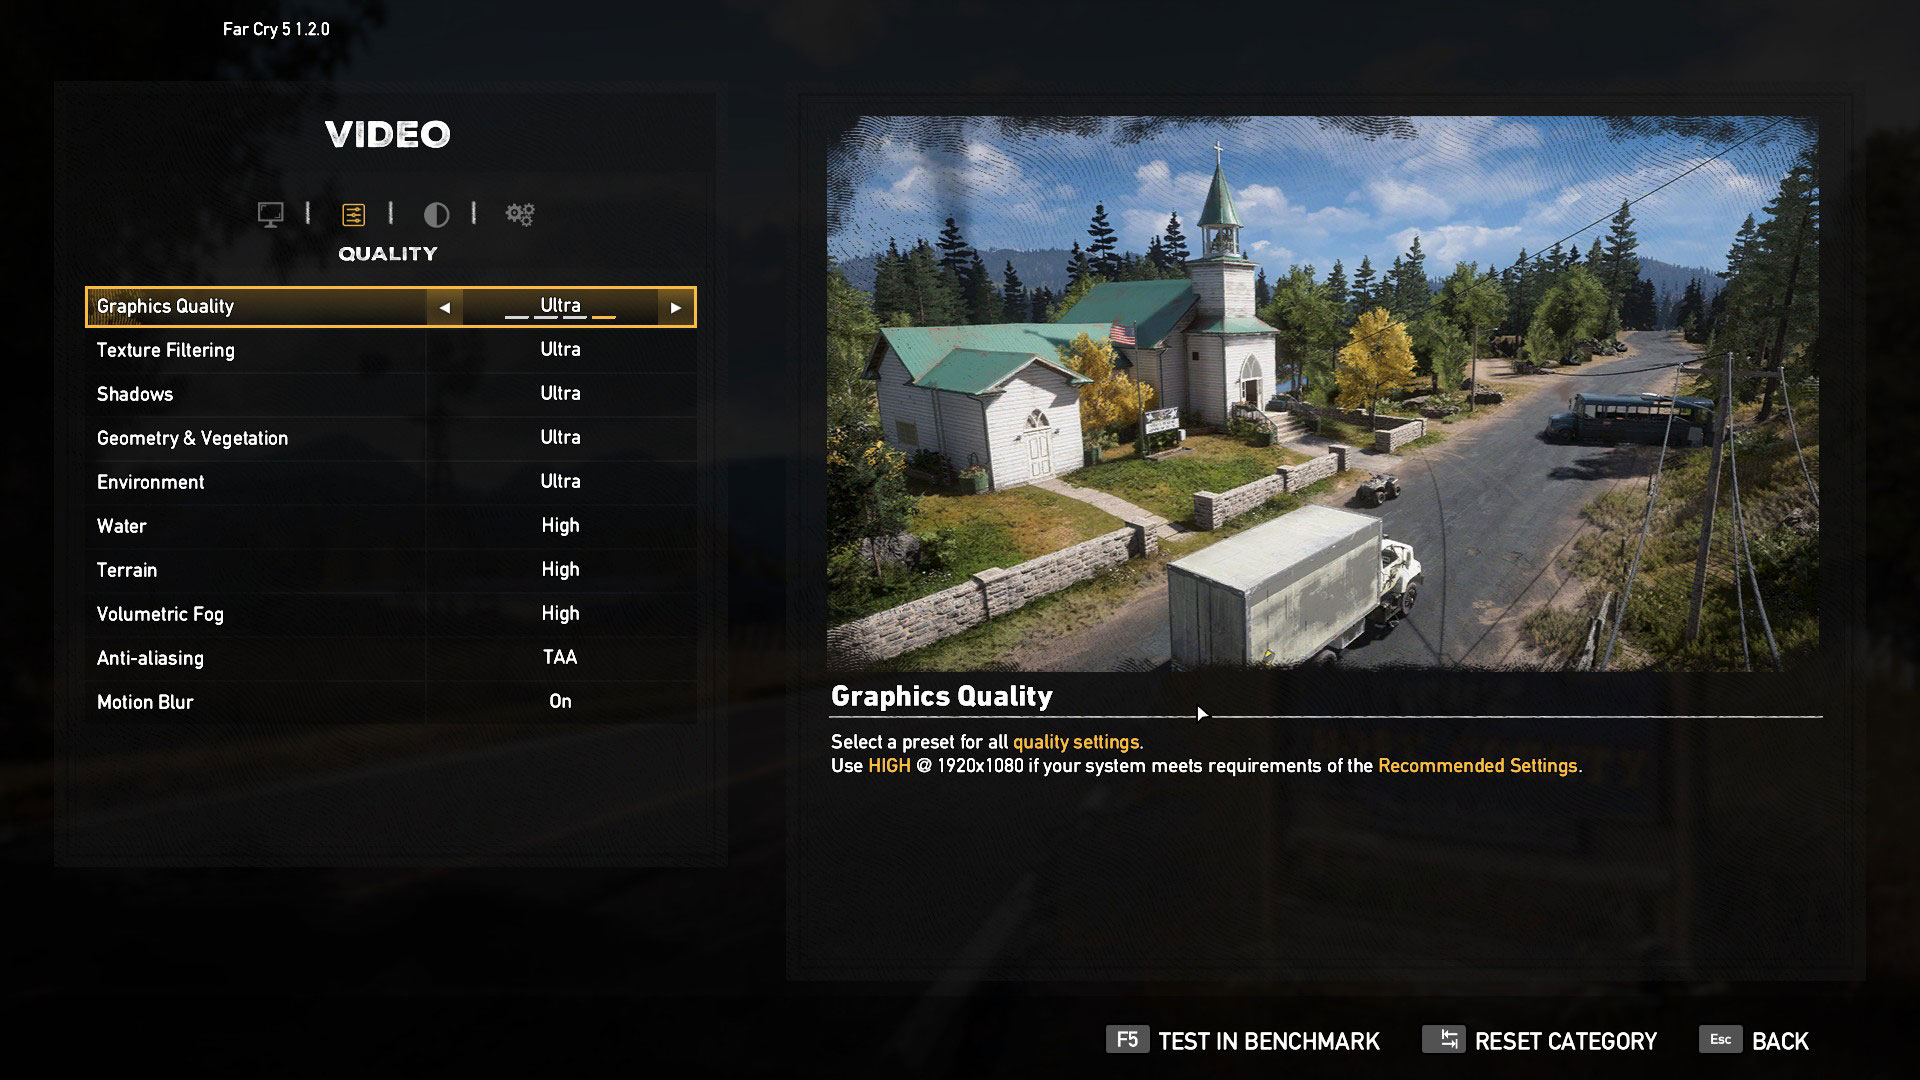
| Far Cry 5 | Full HD, Normal (Check settings) | Full HD, High (Check settings) | Full HD, Ultra (Check settings) |
|---|---|---|---|
| Radeon RX 5300M | 72 fps | 62 fps | 55 fps |
| GeForce GTX 1660 Ti Max-Q | 89 fps (+24%) | 82 fps (+32%) | 76 fps (+38%) |

| Rise of the Tomb Raider (2016) | Full HD, Lowest (Check settings) | Full HD, Medium (Check settings) | Full HD, Very High (Check settings) |
|---|---|---|---|
| Radeon RX 5300M | 115 fps | 85 fps | 43 fps |
| GeForce GTX 1660 Ti Max-Q | 144 fps (+25%) | 112 fps (+32%) | 57 fps (+33%) |

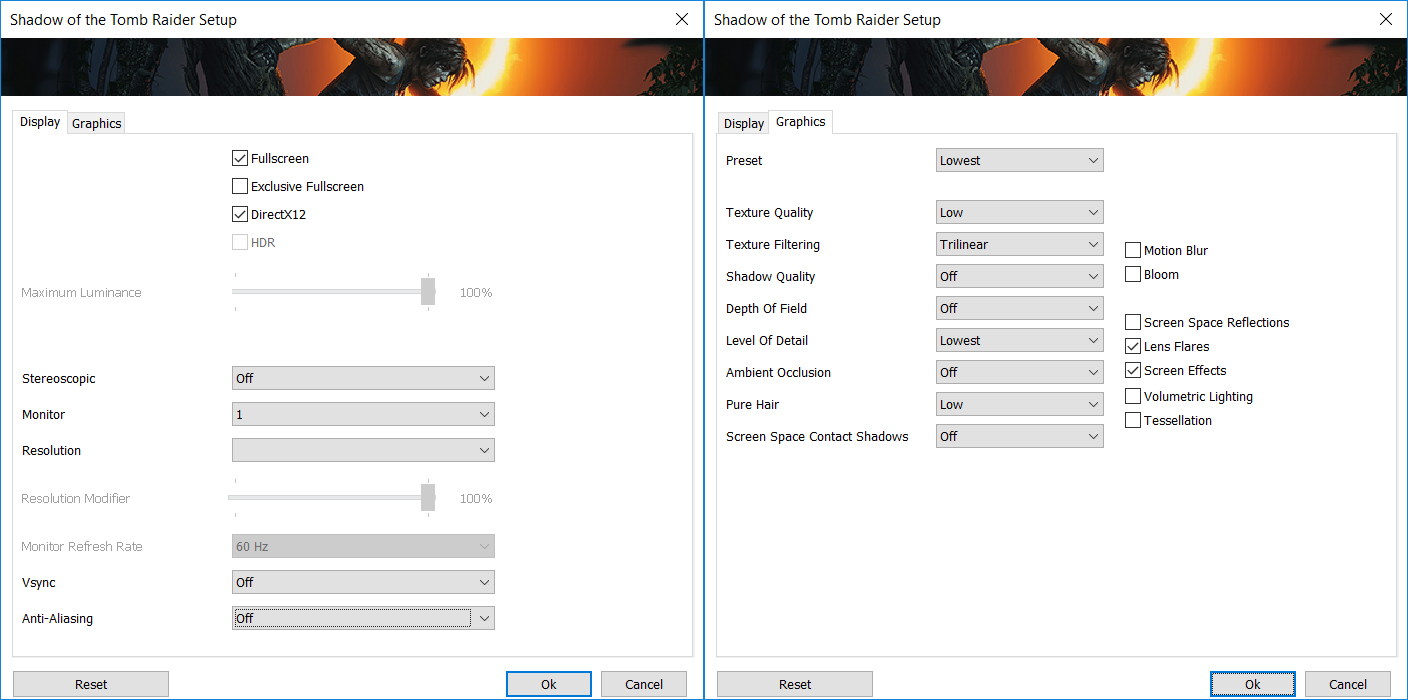
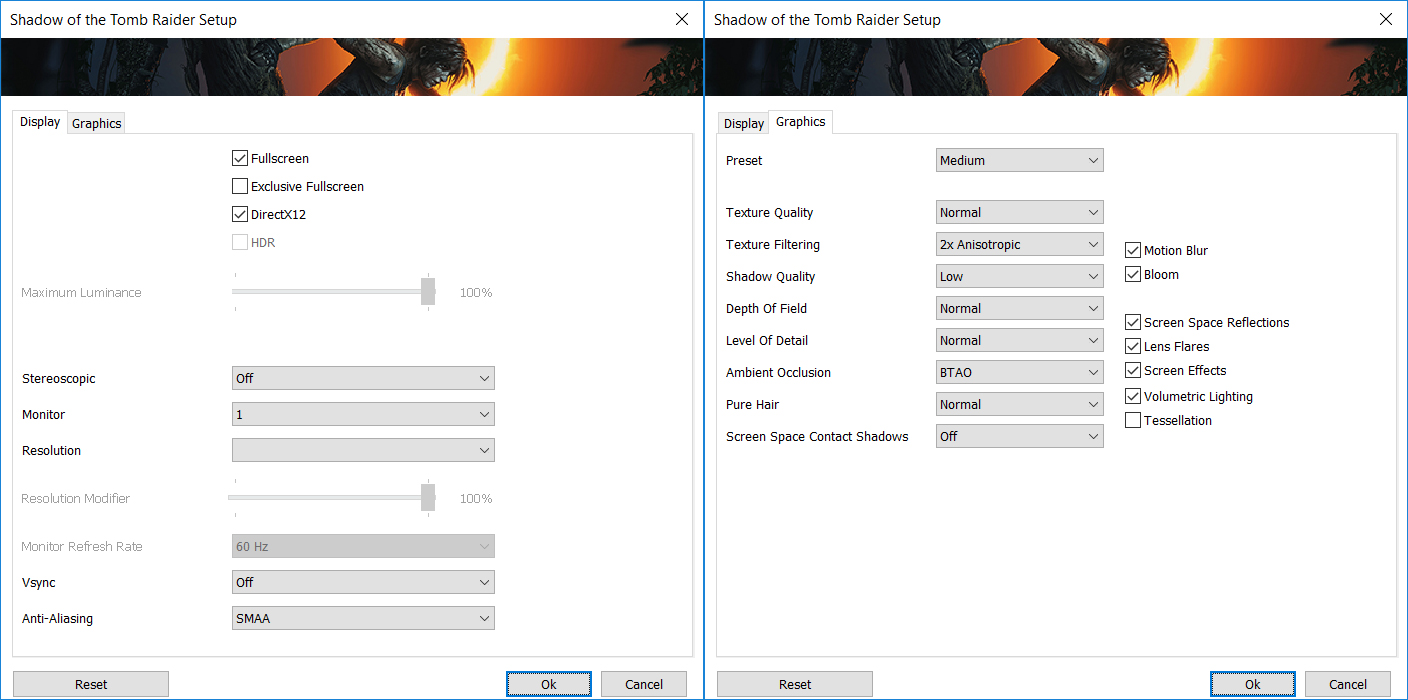
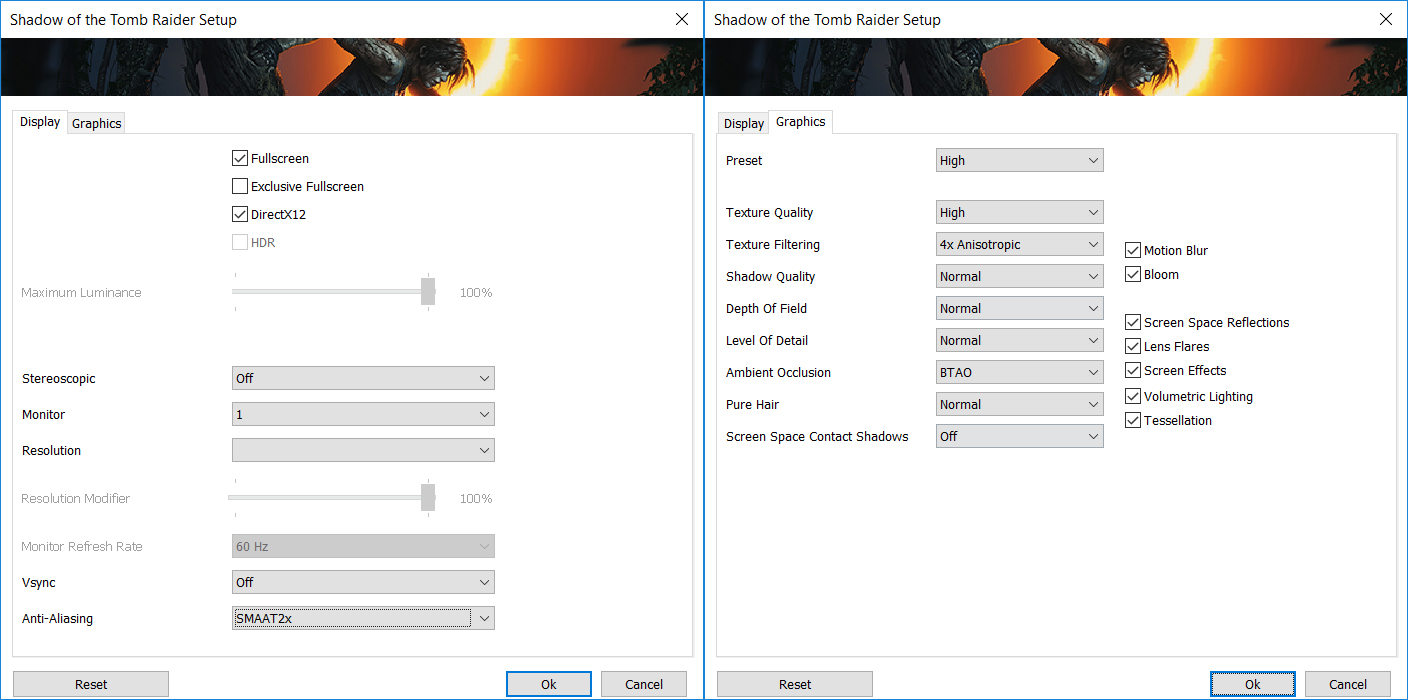
| Shadow of the Tomb Raider (2018) | Full HD, Lowest (Check settings) | Full HD, Medium (Check settings) | Full HD, High (Check settings) |
|---|---|---|---|
| Radeon RX 5300M | 87 fps | 55 fps | 49 fps |
| GeForce GTX 1660 Ti Max-Q | 123 fps (+41%) | 76 fps (+38%) | 71 fps (+45%) |

| Tom Clancy’s Ghost Recon Wildlands | Full HD, Medium (Check settings) | Full HD, High (Check settings) | Full HD, Very High (Check settings) |
|---|---|---|---|
| Radeon RX 5300M | 63 fps | 58 fps | 46 fps |
| GeForce GTX 1660 Ti Max-Q | 85 fps (+35%) | 68 fps (+17%) | 60 fps (+30%) |
Conclusion
The GTX 1660 Ti Max-Q definitely hides its age pretty well, and if we had taken the nameplates off, you wouldn’t even think for a second that this card would perform this well. It had a 21%, 55%, and 45% lead over the RX 5300M in 3DMark Fire Strike, Unigine Heaven 4.0, and Unigine Superposition, respectively. In the gaming tests, the NVIDIA GPU outperformed its Team Red rival across all the games, regardless of the graphics settings.


